 |
 |
 |
 |
Introduction to THz Spectroscopy
The terahertz (THz) spectral region bridges microwave and infrared domains (1 THz = 1012 Hz; see Fig.1). It is also often called a terahertz gap since it was very difficult to explore it. A revolution has come in the eighties when time domain terahertz spectroscopy has been developed. This method is based on generation and coherent detection of broadband terahertz pulses, where both processes of emission and reception are controlled and synchronized by ultrashort laser pulses.

1 THz = 1012 Hz ≈ 1 ps ≈ 0.3 mm ≈ 33 cm–1 ≈ 4.1 meV ≈ 48 K
Fig. 1. Spectrum of electromagnetic radiation. The terahertz region is marked by a green rectangle.
Steady state terahertz spectroscopy starts to find applications out of basic research. In particular, terahertz imaging is extensively explored due to potential applications in medicine and security. Its use is promising namely due to the low photon energy: the "T-rays" (terahertz rays) are thus harmless for any part of human body, unlike X-rays, for example.
In our laboratory, we use terahertz pulses in order to probe ultrafast photo-initiated dynamics in active materials used in solar cells. We thus obtain information about their transport properties with 100 fs (=10–15 s) time resolution. This helps to understand the physical mechanisms responsible for the operation of the solar cell and for further elaboration of active solar cell materials.
Generation and detection of terahertz pulses
A common way to generate pulses of terahertz radiation is by means of optical rectification in non-linear crystals. When an intense ultrashort laser pulse hits such a crystal, its rapidly oscillating electromagnetic field is rectified, giving rise to a terahertz emission. Crystals of ⟨110⟩-oriented ZnTe (zinc telluride) are the most common: when a 1 mm thick crystal is irradiated with 800 nm laser pulses of 100 fs duration, it emits broadband terahertz pulses covering a spectrum from 0 up to ~2.5 THz (Fig. 2).
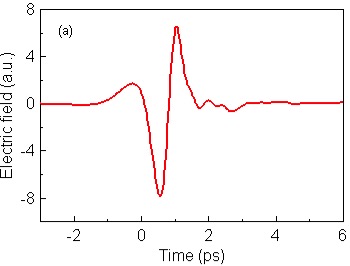

Fig.2. (a) Temporal profile of a terahertz pulse and (b) its amplitude spectrum.
The terahertz pulses are usually detected by means of electro-optic sampling in another non-linear crystal. In this method, the electric field of terahertz pulses induces a birefringence in the non-linear crystal. The instantaneous birefringence is measured as a polarization-state change of an ultrashort optical pulse. Scanning the time of arrival of this optical pulse than allows to characterize the profile of the entire terahertz pulse (Fig. 2a). The spectrum is then calculated as a Fourier transformation of this pulse (Fig. 2b).
Transmission spectroscopy
Transmission spectroscopy is the simplest method for characterizing far-infrared dielectric properties of matters. It usually requires measurement of two waveforms: a waveform Esam(t) when the terahertz beam passes through the sample, and a reference waveform Eref(t) measured when the sample is removed from the THz beam path. Using Fourier transformation, one can evaluate the transmittance spectrum T( f ) of the sample:
![]() (1)
(1)
Providing the sample is optically thick, the transmittance is straightforwardly related to the spectrum of the refractive index n of the sample:
![]() (2)
(2)
where d is the thickness of the sample, and c is the velocity of light in vacuum. The first term represents the Fresnel reflection. The exponential describes the propagation in the sample: the real part of the argument is responsible for the delay of the waveform while its imaginary part accounts for the absorption in the sample.
Time-domain terahertz spectroscopy is a phase-sensitive method: this means, that not only the amplitude of the transmittance is determined, but also its phase is measured. In turn, one can independently evaluate both real and imaginary part of the refractive index n.
This method is illustrated on a 1 mm thick ZnTe crystal. In Fig. 3a, the raw measured waveforms are shown: we can clearly observe the time delay which is caused by insertion of the ZnTe crystal into the terahertz beam. The decrease in the waveform amplitude is caused mainly by Fresnel losses. The refracted index evaluated from Eq.(1) is shown in Fig. 3b.


Fig. 3. (a) Measured THz waveforms. (b) Refractive index of a ZnTe crystal evaluated from Eq. (1).
Terahertz radiation is a particularly sensitive probe of free-carriers. It is thus possible to characterize e.g. doping level or type of charge transport in semiconductors. Also many insulators exhibit a response in the far-infrared range. For example, incipient ferroelectrics like SrTiO3 have polar optical phonons in the terahertz range. The terahertz spectroscopy is than often able to reveal information on soft polar modes and relaxational mechanisms which are frequently responsible for structural (namely ferroelectric) transitions. In polar liquids, the absorption of terahertz radiation arises due to its strong interaction with permanent dipole moments of the individual molecules and subsequent collision-induced relaxation of the oriented dipoles. Conversely, the interaction used to be weak in non-polar liquids due to the absence of permanent dipole moment and free charge carriers.
Optical pump – terahertz probe spectroscopy
In optical pump – terahertz probe spectroscopy (also called time-resolved terahertz spectroscopy), the dynamics photo-initiated by a visible or infrared pump pulse is probed by a delayed terahertz pulse. From the pump-induced change of the probing terahertz pulse it is possible to extract the time-dependent transient conductivity of the studied sample. Owing to the low energy of terahertz photons, optical pump – terahertz probe spectroscopy constitutes an excellent non-destructive non-contact electrical probe of various transport processes.
The analysis of the data from optical pump – terahertz probe spectroscopy is straightforward only when slow processes are investigated. In such a case, a quasi-static approximation applies and the transient conductivity Δσ( f ,τp) can be calculated as function of a pump-probe delay τp [2]:
![]() (3)
(3)
This means, that we need to measure the transient transmission spectrum ΔT( f ,τp) for the given pump-probe delay along with the transmission spectrum T( f ) of the sample in equilibrium. In practice, it this implies measurement of the photo-induced terahertz signal ΔE( f , τp) along with the terahertz signal E( f ) passing through the sample in the ground state. In the expression above, n1 and n2 are refractive indices of the superstrate and substrate, respectively, and d is an absorption length, or thickness of the sample if the sample is thinner than the absorption length. Note that a complicated analysis beyond the quasi-static approximation is required either when the investigated dynamics is faster than the terahertz pulse length, or when the transient conductivity is evaluated for pump-probe delays shorter than the terahertz pulse length [2].
An example of a transient conductivity spectrum is plotted in Fig. 4. It was measured on a silicon wafer excited by wavelength of 570 nm. The conductivity spectrum clearly demonstrates that free charges following a Drude's model are created upon photo-excitation. Another measurement, this time on a microparticles of silicon, can be found in [1].

Fig. 4. Transient conductivity spectrum of a silicon wafer 20 ps after photoexcitation. Points: experiment, lines: fit by a Drude's model with scattering time τs = 205 fs.
Lifted from: http://www.chemphys.lu.se/research/techniques/terahertz/